Chapter 1 Functions and Capabilities
The idea behind CoMarker is to allow for a cell-based approach to marker colocalisation analysis, therefore for the purpose of this manual we will discuss the capabilities of the script for when a nuclei marker is used. If you plan to use the script without a nuclei marker, similar procedures apply, however instead of counts the output will be the total area containing each marker for each image.
1.1 What does CoMarker do?
Counts the number of regions of interest.
Finds the total area of the regions of interest.
Counts the number of cells (based on a 1:1 ratio with the number of nuclei).
Counts the number of cells which contain a reference marker signal.
Counts the number of cells within and outside of a region of interest which contain a reference marker.
Counts the number of cells which contain each marker signal.
Counts the number of cells within and outside of a region of interest which contain each marker.
Counts the number of cells positive for both the reference marker and each other marker (colocalised).
Counts the number of cells within and outside of a region of interest positive for both the reference marker and each other marker (colocalised).
Identifies image outliers and potential poor quality images (based on count distribution).
Presents the proportion of marker-positive cells throughout the image and within the region of interest.
Presents the proportion of reference marker-positive cells which are colocalised with each other marker, both respective and irrespective of the region of interest.
Performs statistical test to assess the differences between specified groups of interest (i.e disease vs control)
Produces a report, displaying a range of analysis graphs, parameters used and image outliers.
1.2 Functionality Comparison
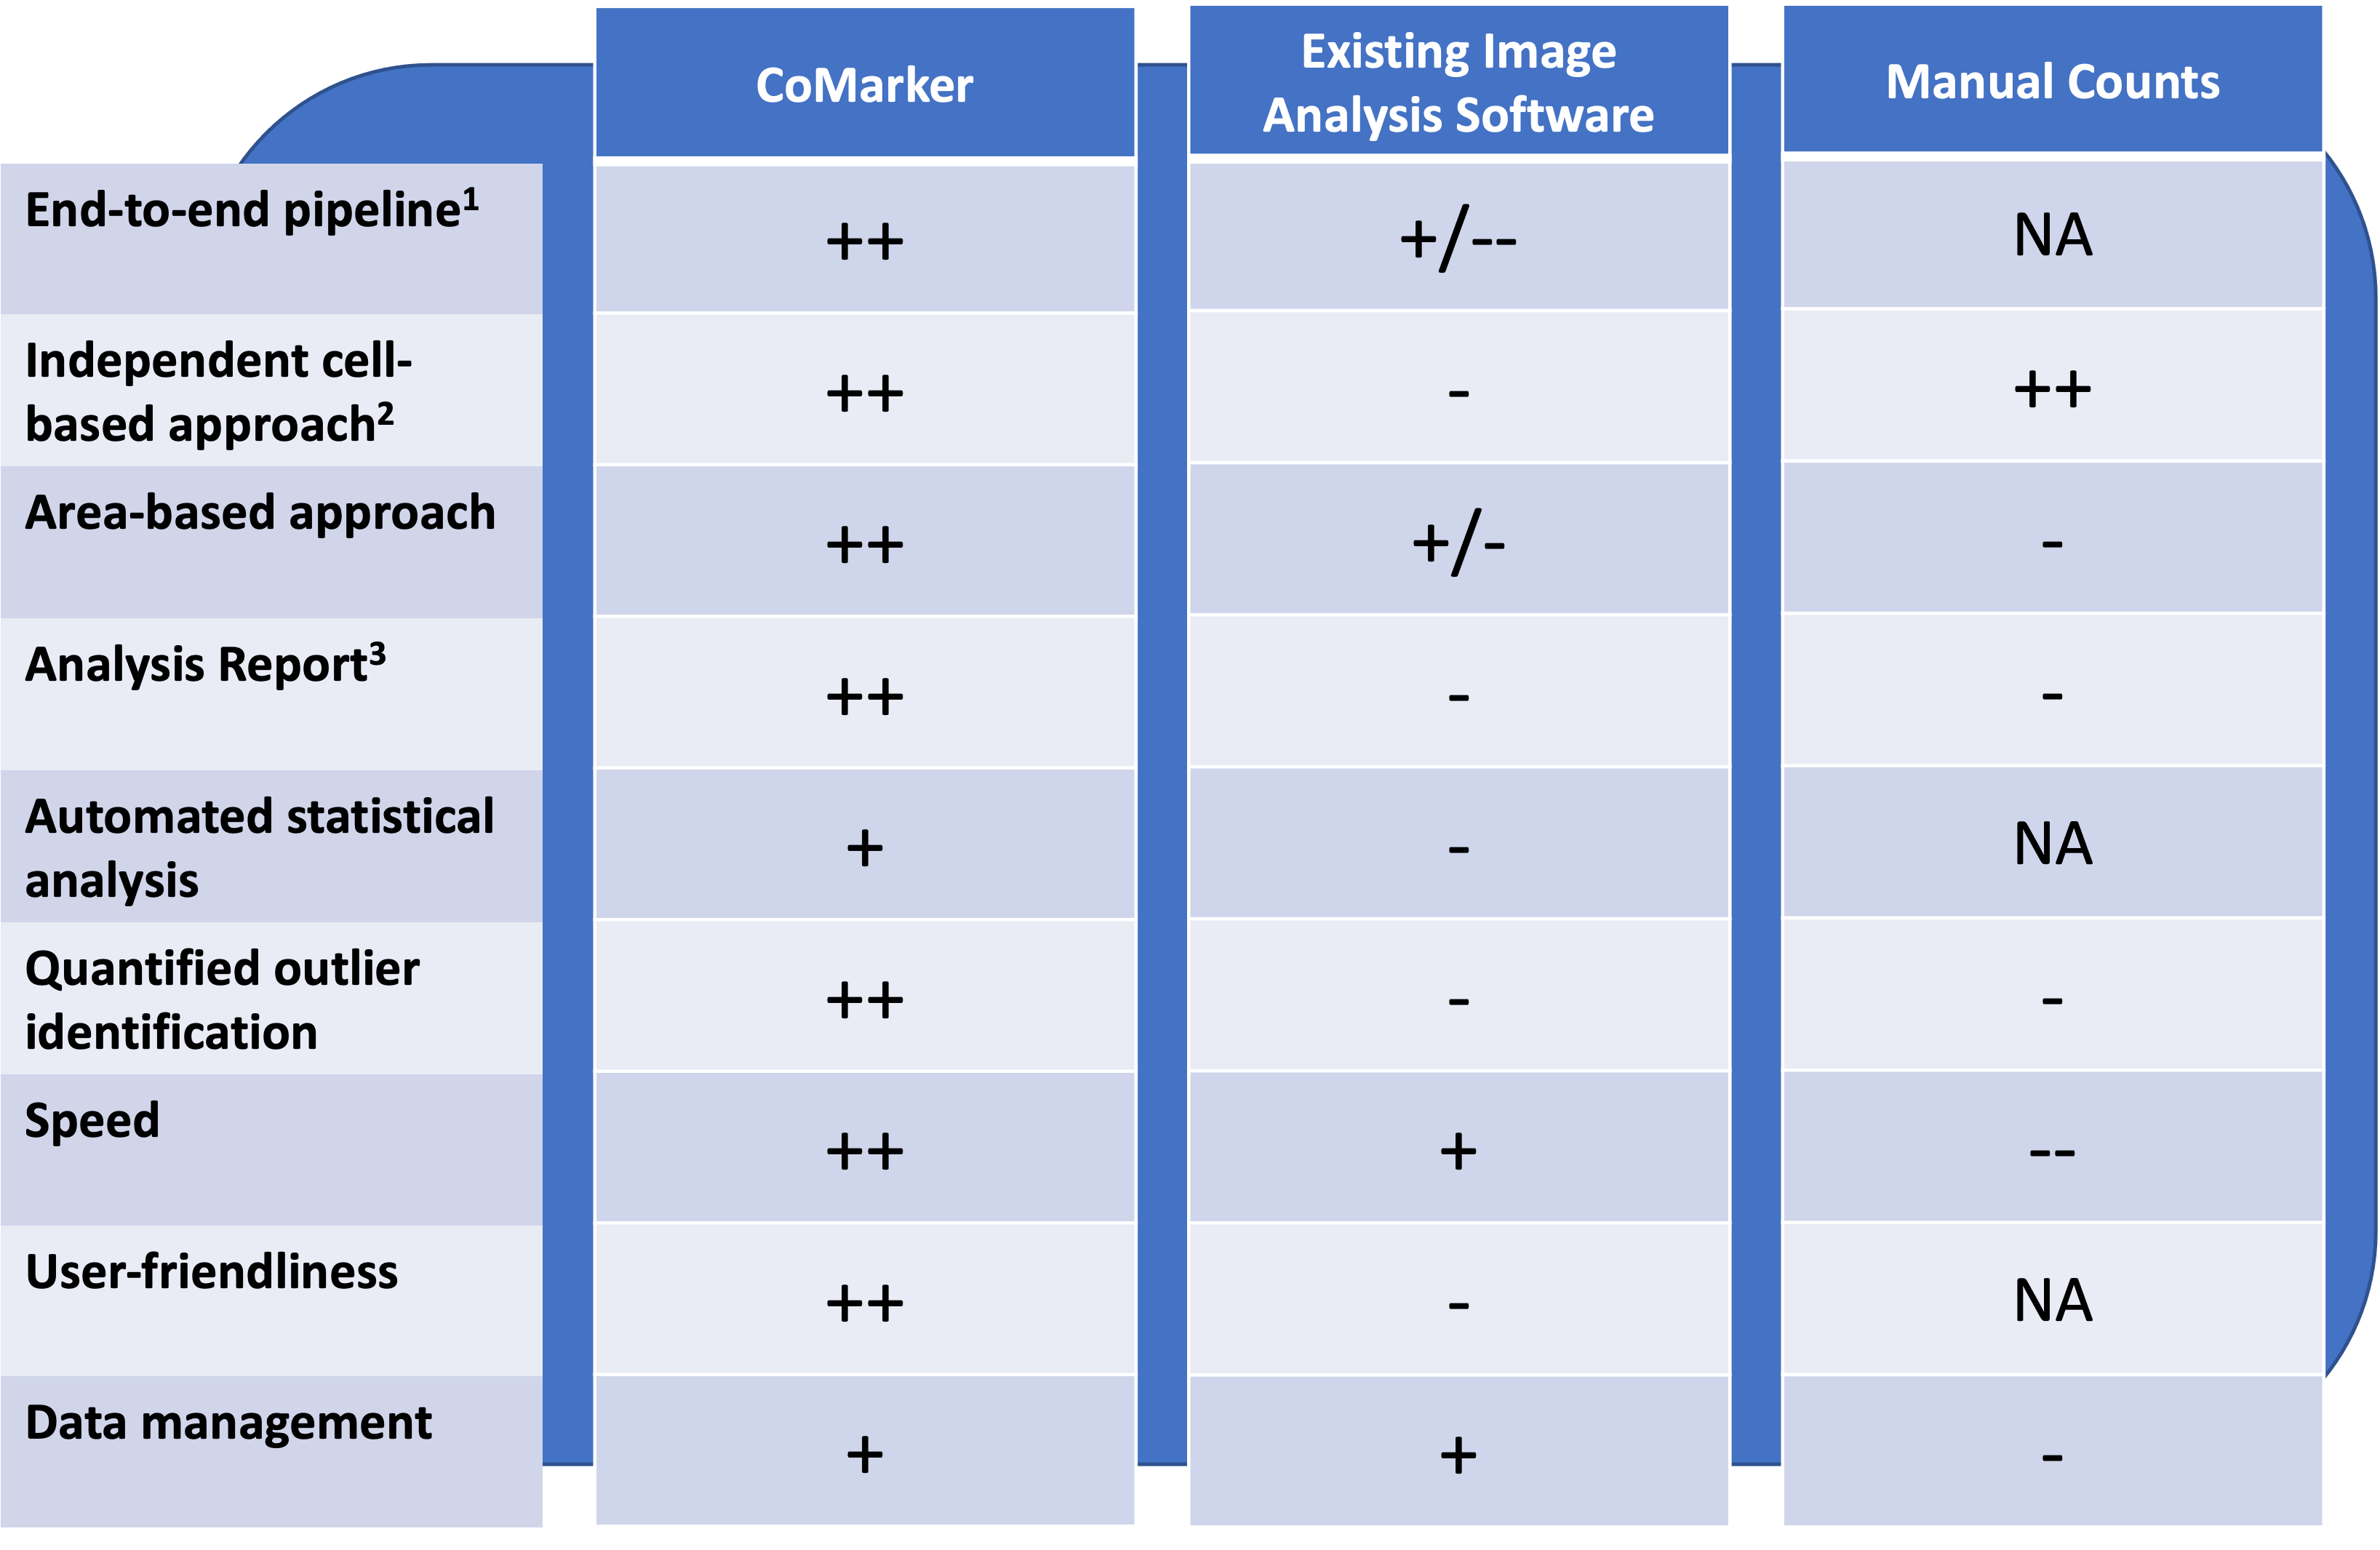
A table comparing CoMarker with existing image analysis software and manual counts.
1 We refer to CoMarker as an end-to-end pipeline due to its ability to perform a comprehensive analysis, from raw image to analysis report, independent of external software.
2 CoMarker performs its cell-based analysis independent of external software and doesn’t require a mask input.
3 CoMarker produces a user-friendly, presentable, and interactive analysis report with annotated statistical significance.